Monitoristic v1: What You Get and What's Coming Next
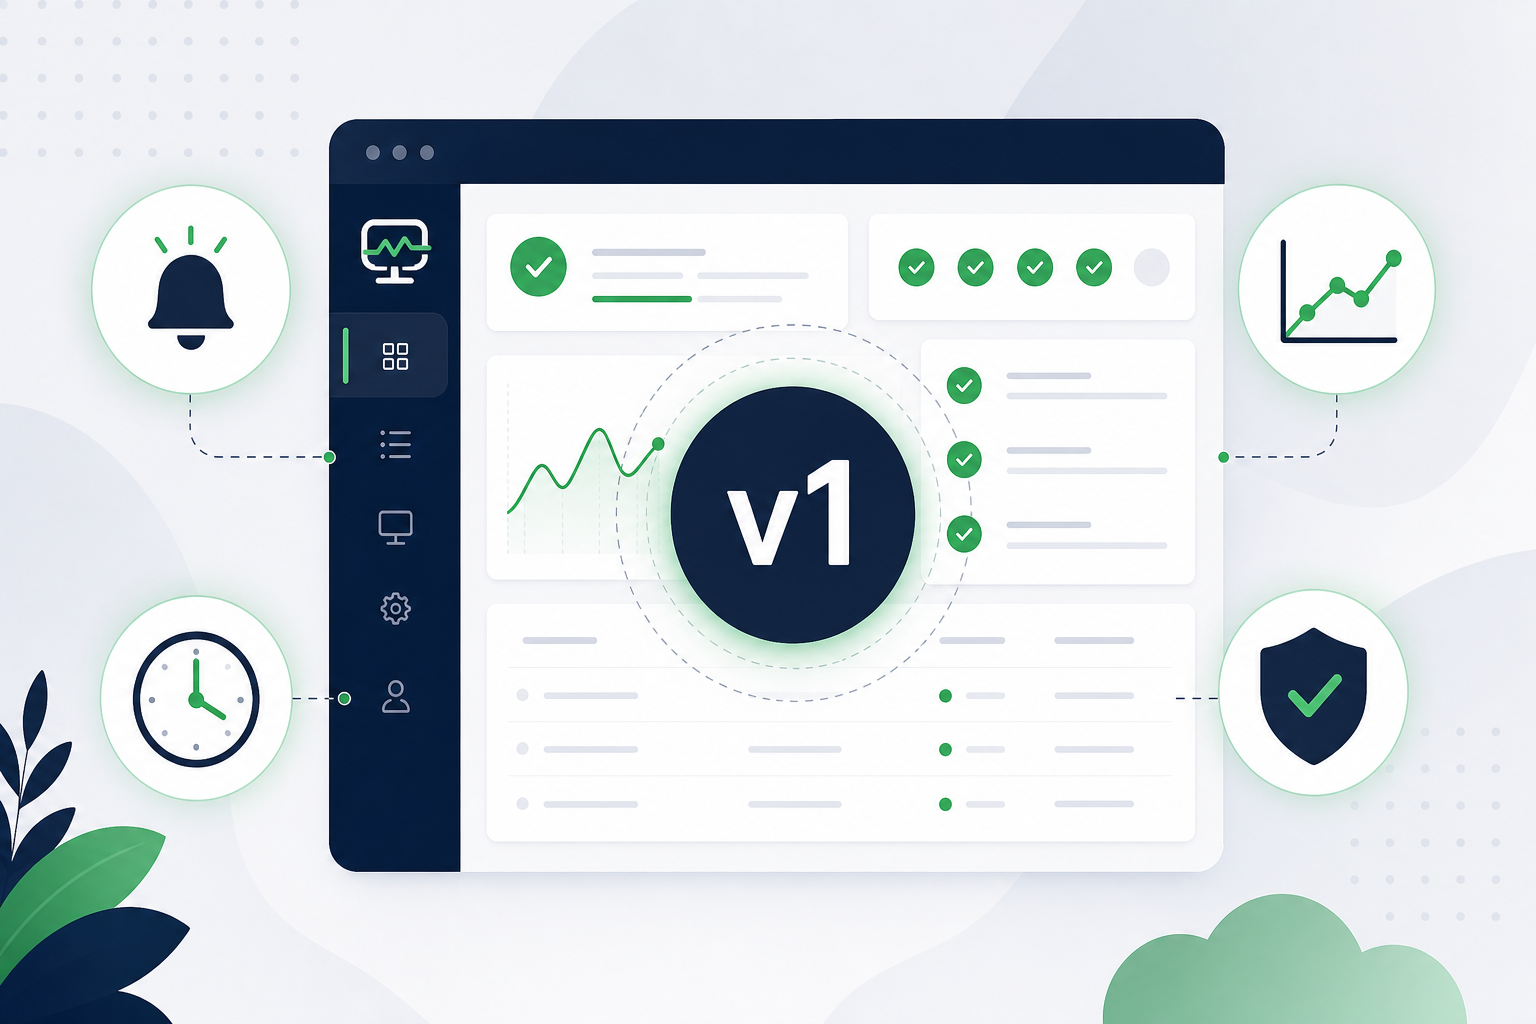
We shipped Monitoristic v1. Not a beta, not an MVP with a disclaimer — a product we're confident enough to charge for and stand behind.
This post is the full picture: what's included today, what's honestly not here yet, and where we're headed. If you're evaluating Monitoristic, this is everything you need to know in one place.
What's Live Today
HTTP Monitoring
Monitor any URL that responds to HTTP requests. Websites, APIs, health check endpoints, admin panels — if it has a URL, you can monitor it.
Each monitor is configurable:
- HTTP method: GET, HEAD, or POST
- Expected status code: Define what "healthy" means (200, 204, 301 — whatever your endpoint returns)
- Timeout: How long to wait before marking a check as failed
- Request headers: Add custom headers for authenticated endpoints
- Slow response threshold: Get flagged when response times creep above your defined limit
Check intervals depend on your plan: every 5 minutes (Lite), 2 minutes (Pro), or 1 minute (Business). All checks run from Cloudflare's global edge infrastructure.
For a detailed walkthrough of each setting, see the monitor setup guide.
Instant Alerts
When a check fails, you get notified immediately. No batching, no digest emails, no waiting for the next check cycle.
Two alert channels are available today:
- Telegram: Messages sent directly to your phone via a bot you configure. Setup takes about 2 minutes.
- Webhooks: Send structured JSON payloads to any HTTP endpoint — Slack, Discord, PagerDuty, or your own backend. Unlimited webhook channels on every plan.
Recovery notifications are automatic. When your site comes back up, you get a second alert confirming it's healthy again.
Public Status Pages
Give your users a place to check your system status without opening a support ticket.
Each status page shows:
- Current status of every monitor you choose to include
- 30-day uptime history bar
- Active and recent incidents
- Your branding
Share the URL with customers, embed it in your docs, or link it from your footer. It updates automatically — no manual publishing needed.
Learn more about setting one up in How to Set Up a Public Status Page.
Incident Tracking
Incidents are created automatically when a monitor goes down and resolved when it recovers. Every incident includes:
- Start and end timestamps
- Duration
- Affected monitor
- Full timeline of status changes
You can also post manual updates to incidents — useful for communicating "we're investigating" or "fix deployed" to your team or users. Incidents appear on your status page automatically.
Maintenance Windows
Schedule planned downtime without triggering false alerts. Set a start time and duration, and Monitoristic pauses alerting for that monitor during the window.
If maintenance runs longer than expected, auto-extension keeps the window open so you don't get false recovery/down alerts mid-deploy.
More details in How to Use Maintenance Windows.
Response Time Tracking
Every check records how long the response took. Over time, this builds a picture of your site's performance:
- Spot gradual slowdowns before they become outages
- Set slow response thresholds per monitor
- Track response time trends to correlate with deployments or traffic changes
A site that averages 200ms but starts creeping to 800ms after a deploy is telling you something — even if it's technically still "up."
What's NOT Included Yet
We'd rather be honest about gaps than have you find out after signing up.
Not available today:
- Email alerts — Coming next. Right now, Telegram and webhooks cover most use cases, but we know email is expected.
- Slack and Discord as native channels — Currently possible via webhooks, but dedicated integrations with richer formatting are on the roadmap.
- Multi-region checks — Checks currently run from a single edge location. Multi-region with location-aware alerting is planned.
- Custom domains for status pages — Status pages use our domain today. Custom domain support (status.yourdomain.com) is coming.
- Public API — No external API yet. It's on the roadmap for teams that want to manage monitors programmatically.
We publish our roadmap on the changelog page and update it as priorities shift based on user feedback.
Pricing
Three plans, every feature included on all of them:
- Lite — $5/month: 5 monitors, 5-minute checks
- Pro — $15/month: 20 monitors, 2-minute checks
- Business — $30/month: 100 monitors, 1-minute checks
Annual billing saves 20%. Every plan includes alerts, status pages, incident tracking, maintenance windows, and response time tracking. No features locked behind higher tiers.
14-day money-back guarantee, no questions asked. Full details at monitoristic.com/pricing.
Product Hunt supporters: We're offering 20% off any plan as a thank-you. Use code at checkout — details on our Product Hunt page.
What's Next
Our immediate roadmap:
- Email alerts — The most requested missing piece
- Custom domains for status pages — Use your own domain for a branded experience
- Slack and Discord integrations — Native channels with rich formatting
- Public API — Programmatic monitor management
We don't put dates on roadmap items. We ship when it's ready and we're confident in the quality. Follow the changelog for updates.
Built for Small Teams
Monitoristic exists because every monitoring tool we evaluated was either free with painful limitations or expensive with features most teams never touch. We built the tool we wanted: simple setup, reliable alerts, transparent pricing, and nothing we wouldn't use ourselves.
If you're a solo developer, a startup, an agency managing client sites, or a small team that just needs to know when things go down — that's exactly who we built this for.
We're listening to every piece of feedback. Tell us what's working, what's missing, and what would make you switch from whatever you're using today.